How does List Manager work?
In the mid-90s, I started investigating the sorting of players into height and age groups. This progressed into looking at the distribution further, especially amongst the various premiership lists and observing that they conformed towards, but not quite, a normal distribution.
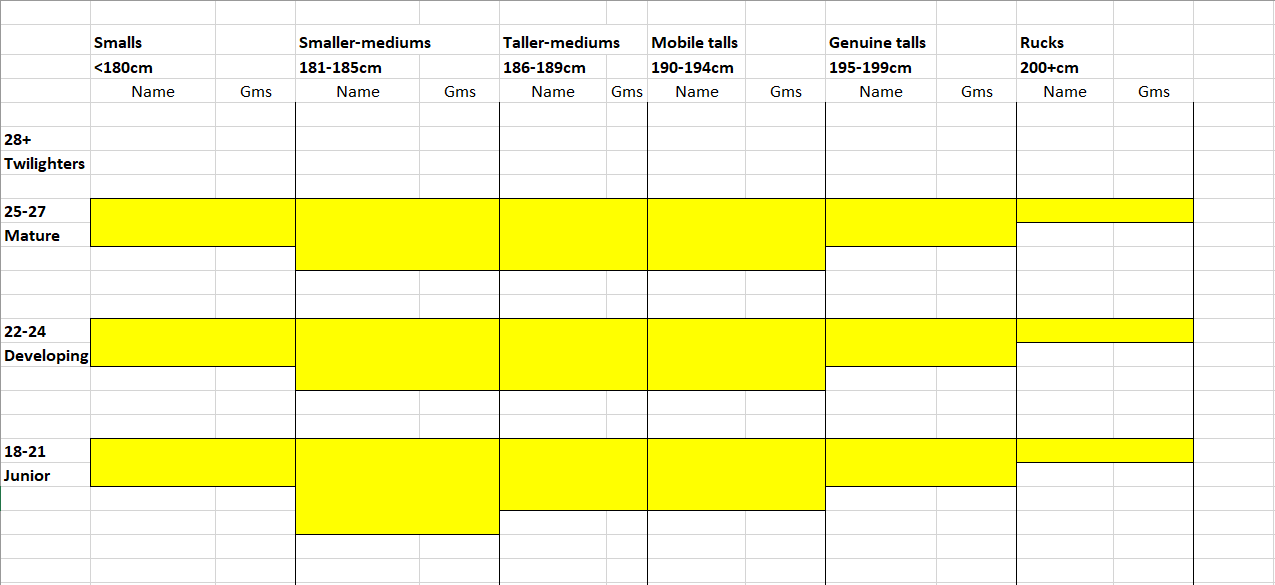
By 2005, I found that the distributions had a mode in the "taller-medium" (185-189cm) height group, with the most popular age group being the "junior" (18-21yo) group. The distribution was skewed to the right so that most of the population of premiership lists lay between the 180-195cm height group, then more lying between the 175-199cm height group, with a skew of outliers above 200cm, usually rucks.
Another interesting observation was that there was no consistency nor conformity in premiership lists as to those players aged 28-plus. Those 28-years-plus players were on the lists only because they had established themselves as leaders or "stars". If they weren't a leader or "star" at 28+, they had been traded or delisted from premiership lists, regardless of their height, weight, games played, etc. In fact, what became apparent is that teams that were beginning a premiership window conformed to the yellow area below, and teams exiting a premiership window had more 28+yo players over the height ranges.
From then on, I have included other individual player parameters such weight, games, positions played, quality levels (AA elite, down to D, consistently not selected) and form trends of up, static or down.
The weight distributions indicated that a premiership player had an ideal weight that was just above the last two digits of his height, e.g., H 186cm, W 89kg, and of of players above 200cm, e.g., H 203cm, W 105kg.
However, I haven't included these further parameters or fields into the matrix presented here because it makes the matrix far too complicated to read and understand.
Therefore, I present to you a model of what lists entering a premiership window should look like.
Also, when sorting into groups, I have given each group a label, I will refer to these labels often, and these are listed below.
The distribution presents itself as follows: